Penerapan MongoDB dengan Visual Code
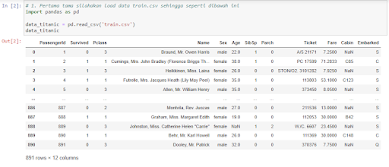
Pada pembahasan kali ini, kita menggunakan data Microsoft Stock Price (2000-2023) yang diambil dari https://www.kaggle.com/datasets, dengan tampilan dibawah ini :
1. Import datasheet ke MongoDB
2. Membuat CRUD
3. Mevisualisasikan data dan membuat grafik yang diambil minimal 3 kategori
Langkah-langkah :
1. Import data ke MongoDB dengan format csv dengan perintah seperti dibawah :
import csv
from pymongo import MongoClient
import os
# Inisialisasi koneksi ke MongoDB
client = MongoClient('mongodb://localhost:27017/')
db = client['pbl']
koleksi = db['msft']
# Path ke file CSV
file_name = 'msft.csv'
path_csv = os.path.join(os.path.dirname(__file__), file_name)
# Periksa keberadaan file CSV
if not os.path.isfile(path_csv):
print(f"File '{file_name}' tidak ditemukan dalam direktori yang sama dengan skrip.")
print("Pastikan file CSV berada di direktori yang benar atau periksa kembali nama file.")
exit()
# Impor data dari file CSV ke MongoDB
with open(path_csv, 'r') as csvfile:
csv_reader = csv.DictReader(csvfile)
for row in csv_reader:
koleksi.insert_one(row)
print("Data dari CSV berhasil diimpor ke MongoDB.")
2. Membuat file baru app.py dengan memasukan script dibawah ini :
# import csv
from flask import Flask, render_template, request, redirect
from pymongo import MongoClient
from bson import ObjectId
import plotly.graph_objects as go
app = Flask(__name__)
client = MongoClient('mongodb://localhost:27017/')
db = client['pbl']
koleksi = db['msft'] # Menggunakan nama koleksi 'stock_data'
def index():
data_cursor = koleksi.find()
formatted_data = []
header = ['date','open','high','low','close','adj_close','volume']
for row in data_cursor:
formatted_row = {key: row[key] for key in header}
formatted_data.append(formatted_row)
return render_template('index.html', data=formatted_data)
# Rute lainnya untuk tambah, edit, dan hapus data
# Rute untuk menampilkan data dan melakukan pencarian
@app.route('/', methods=['GET', 'POST'])
def index():
if request.method == 'POST':
query = request.form.get('query')
if query:
data_cursor = koleksi.find({
'$or': [
{'date': {'$regex': query, '$options': 'i'}},
{'open': {'$regex': query, '$options': 'i'}},
{'high': {'$regex': query, '$options': 'i'}},
{'low': {'$regex': query, '$options': 'i'}},
{'close': {'$regex': query, '$options': 'i'}},
{'adj_close': {'$regex': query, '$options': 'i'}},
{'volume': {'$regex': query, '$options': 'i'}}
]
})
data_list = list(data_cursor)
return render_template('index.html', data=data_list)
else:
return redirect('/')
else:
data_cursor = koleksi.find()
data_list = list(data_cursor)
return render_template('index.html', data=data_list)
@app.route('/graph')
def show_graph():
# Menghitung Microsoft Stock berdasarkanberdasarkan industri
high_counts = koleksi.aggregate([
{"$group": {"_id": "$high", "count": {"$sum": 1}}}
])
# Menghitung Microsoft Stock berdasarkanberdasarkan industri
low_counts = koleksi.aggregate([
{"$group": {"_id": "$low", "count": {"$sum": 1}}}
])
# Menghitung Microsoft Stock berdasarkanberdasarkan industri
volume_counts = koleksi.aggregate([
{"$group": {"_id": "$volume", "count": {"$sum": 1}}}
])
# Membuat dictionary untuk variabel high, year_founded, dan countr
high= {item['_id']: item['count'] for item in high_counts}
low = {item['_id']: item['count'] for item in low_counts}
volume = {item['_id']: item['count'] for item in volume_counts}
# Membuat grafik batang untuk industri
fig_high = go.Figure()
fig_high.add_trace(go.Bar(x=list(high.keys()), y=list(high.values()), marker=dict(color='rgb(0, 136, 248)', opacity=1)))
fig_high.update_layout(title='Microsoft Stock berdasarkanberdasarkan high', xaxis_title='high', yaxis_title='Jumlah')
# Membuat grafik batang untuk low
fig_low = go.Figure()
fig_low.add_trace(go.Bar(x=list(low.keys()), y=list(low.values()), marker=dict(color='rgb(255, 90, 30)', opacity=1)))
fig_low.update_layout(title='Microsoft Stock berdasarkanberdasarkan low', xaxis_title='low', yaxis_title='Jumlah')
# Membuat grafik batang untuk volume
fig_volume = go.Figure()
fig_volume.add_trace(go.Bar(x=list(volume.keys()), y=list(volume.values()), marker=dict(color='rgb(68, 0, 255)', opacity=1)))
fig_volume.update_layout(title='Microsoft Stock berdasarkanberdasarkan volume', xaxis_title='volume', yaxis_title='Jumlah')
# Konversi grafik ke HTML
graph_html_high = fig_high.to_html(full_html=False)
graph_html_low = fig_low.to_html(full_html=False)
graph_html_volume = fig_volume.to_html(full_html=False)
return render_template('graph.html', graph_html_high=graph_html_high, graph_html_low=graph_html_low, graph_html_volume=graph_html_volume)
# Rute lainnya untuk tambah, edit, dan hapus data...
# Rute untuk menambah data baru
@app.route('/add', methods=['POST'])
def add():
new_data = {
'date': request.form['date'],
'open': request.form['open'],
'high': request.form['high'],
'low': request.form['low'],
'close': request.form['close'],
'adj_close': request.form['adj_close'],
'volume': request.form['volume']
}
koleksi.insert_one(new_data)
return redirect('/')
# Rute untuk menghapus data
@app.route('/delete/<id>', methods=['GET'])
def delete(id):
koleksi.delete_one({'_id': ObjectId(id)})
return redirect('/')
# Rute untuk menampilkan form edit
@app.route('/edit/<id>', methods=['GET'])
def edit(id):
data = koleksi.find_one({'_id': ObjectId(id)})
return render_template('edit.html', data=data)
# Rute untuk menyimpan perubahan dari form edit
@app.route('/update/<id>', methods=['POST'])
def update(id):
updated_data = {
'date': request.form['date'],
'open': request.form['open'],
'high': request.form['high'],
'low': request.form['low'],
'close': request.form['close'],
'adj_close': request.form['adj_close'],
'volume': request.form['volume']
}
koleksi.update_one({'_id': ObjectId(id)}, {'$set': updated_data})
return redirect('/')
if __name__ == '__main__':
app.run(debug=True)
3. Membuat folder pada template dengan 3 file yaitu edit.html, index.html, dan graph.html
- Masukan script pada file edit.html seperti dibawah ini :
<!DOCTYPE html>
<html lang="en">
<head>
<meta charset="UTF-8" />
<meta http-equiv="X-UA-Compatible" content="IE=edge" />
<meta name="viewport" content="width=device-width, initial-scale=1.0" />
<title>Edit Data</title>
<style>
/* Atur gaya sesuai kebutuhan Anda */
</style>
</head>
<body>
<h1>Edit Data</h1>
<form action="/update/{{ data._id }}" method="POST">
<label for="date">Date:</label>
<input type="text" id="date" name="Date" value="{{ data.Date }}" />
<!-- Menggunakan field sesuai dengan header pada koleksi MongoDB -->
<label for="open">Open:</label>
<input type="text" id="open" name="Open" value="{{ data.Open }}" />
<label for="high">High:</label>
<input type="text" id="high" name="High" value="{{ data.High }}" />
<label for="low">Low:</label>
<input type="text" id="low" name="Low" value="{{ data.Low }}" />
<label for="close">Close:</label>
<input type="text" id="close" name="Close" value="{{ data.Close }}" />
<label for="adj_close">Adj Close:</label>
<input type="text" id="adj_close" name="Adj Close" value="{{ data['Adj Close'] }}" />
<label for="volume">Volume:</label>
<input type="text" id="volume" name="Volume" value="{{ data.Volume }}" />
<button type="submit">Update Data</button>
</form>
</body>
</html>
- Masukan sripct pada file index.html seperti dibawah ini :
<!DOCTYPE html>
<html lang="en">
<head>
<meta charset="UTF-8" />
<meta http-equiv="X-UA-Compatible" content="IE=edge" />
<meta name="viewport" content="width=device-width, initial-scale=1.0" />
<title>Stock Market Data</title>
<style>
/* Your CSS styles */
table {
border-collapse: collapse;
width: 100%;
}
th,
td {
border: 1px solid black;
padding: 8px;
text-align: left;
}
form {
margin-bottom: 20px;
}
/* ... Other styles for table columns and forms */
</style>
</head>
<body>
<h1>Stock Market Data</h1>
<p>Data Length: {{ data|length }}</p>
<button
type="button"
onclick="window.location.href='/graph'"
style="width: 150px; height: 25px; margin-top: 10px; margin-bottom: 10px"
>
Tampilkan Grafik
</button>
<!-- Form for searching -->
<form action="/" method="POST">
<label for="search">Search by Value:</label>
<input
type="text"
id="search"
name="query"
placeholder="Enter a numerical value"
/>
<button type="submit">Search</button>
</form>
<!-- Form for adding data -->
<form action="/add" method="POST">
<label for="date">Date:</label>
<input type="text" id="date" name="date" />
<label for="open">Open:</label>
<input type="text" id="open" name="open" />
<label for="high">High:</label>
<input type="text" id="high" name="high" />
<label for="low">Low:</label>
<input type="text" id="low" name="low" />
<label for="close">Close:</label>
<input type="text" id="close" name="close" />
<label for="adj_close">Adj Close:</label>
<input type="text" id="adj_close" name="adj_close" />
<label for="volume">Volume:</label>
<input type="text" id="volume" name="volume" />
<button type="submit">Add Data</button>
</form>
<!-- Table to display stock market data -->
<table>
<thead>
<tr>
<th>Date</th>
<th>Open</th>
<th>High</th>
<th>Low</th>
<th>Close</th>
<th>Adj Close</th>
<th>Volume</th>
<th>Action</th>
<!-- Action column for editing or deleting -->
</tr>
</thead>
<tbody>
{% for row in data %}
<tr>
<td>{{ row.date }}</td>
<td>{{ row.open }}</td>
<td>{{ row.high }}</td>
<td>{{ row.low }}</td>
<td>{{ row.close }}</td>
<td>{{ row.adj_close }}</td>
<td>{{ row.volume }}</td>
<td>
<form action="/edit/{{ row._id }}" method="GET">
<button type="submit">Edit Data</button>
</form>
<form action="/delete/{{ row._id }}" method="GET">
<button type="submit">Delete</button>
</form>
</td>
</tr>
{% endfor %}
</tbody>
</table>
</body>
</html>
- Masukan sripct pada file graph.html seperti dibawah ini :
<!DOCTYPE html>
<html lang="en">
<head>
<meta charset="UTF-8" />
<meta http-equiv="X-UA-Compatible" content="IE=edge" />
<meta name="viewport" content="width=device-width, initial-scale=1.0" />
<title>Grafik Microsoft</title>
<!-- Sertakan dependensi Plotly dan CSS lainnya jika diperlukan -->
<!-- Plotly CDN -->
<script src="https://cdn.plot.ly/plotly-latest.min.js"></script>
<style>
/* Gaya CSS untuk kontainer grafik */
.graph-container {
margin: 20px; /* Atur margin sesuai kebutuhan Anda */
}
/* Gaya CSS untuk warna batang pada grafik industri */
.bar-high {
fill: rgb(0, 136, 248); /* Warna batang */
opacity: 1; /* Tingkat transparansi */
}
/* Gaya CSS untuk warna batang pada grafik funding */
.bar-low {
fill: rgb(255, 90, 30); /* Warna batang */
opacity: 1; /* Tingkat transparansi */
}
/* Gaya CSS untuk warna batang pada grafik benua*/
.bar-volume {
fill: rgb(68, 0, 255); /* Warna batang */
opacity: 1; /* Tingkat transparansi */
}
</style>
</head>
<body>
<!-- Grafik Industri -->
<div class="graph-container bar-high">
{{ graph_html_high|safe }}
</div>
<!-- Grafik funding-->
<div class="graph-container bar-low">{{ graph_html_low|safe }}</div>
<!-- Grafik baenua -->
<div class="graph-container bar-volume">
{{ graph_html_volume|safe }}
</div>
</body>
</html>
Jika ingin menampilkan data, kita run di app.py seperti dibawah ini :
Akan muncul tampilan Running on http://127.0.0.1:5000 dan dapat kita cek pada browser
Hasil :
1. Tampilan awal
2. Tampilan edit
3. Tampilan Grafik
.png)

.png)
.png)


.png)

Komentar
Posting Komentar